Debugger
Project owners and editors can use the Debugger to track variables and playtest the project.
⚠️ Debug info is visible only to owners and editors; see Roles in the Workspaces section of this documentation.
Access the Debugger
To open the Debugger:
- Click on an empty area of the Play Mode browser window.
- Click on the Debug icon, at the top navbar.
- You can resize the Debugger by dragging the left vertical line separating it from Play Mode's current view.
Identifiers display
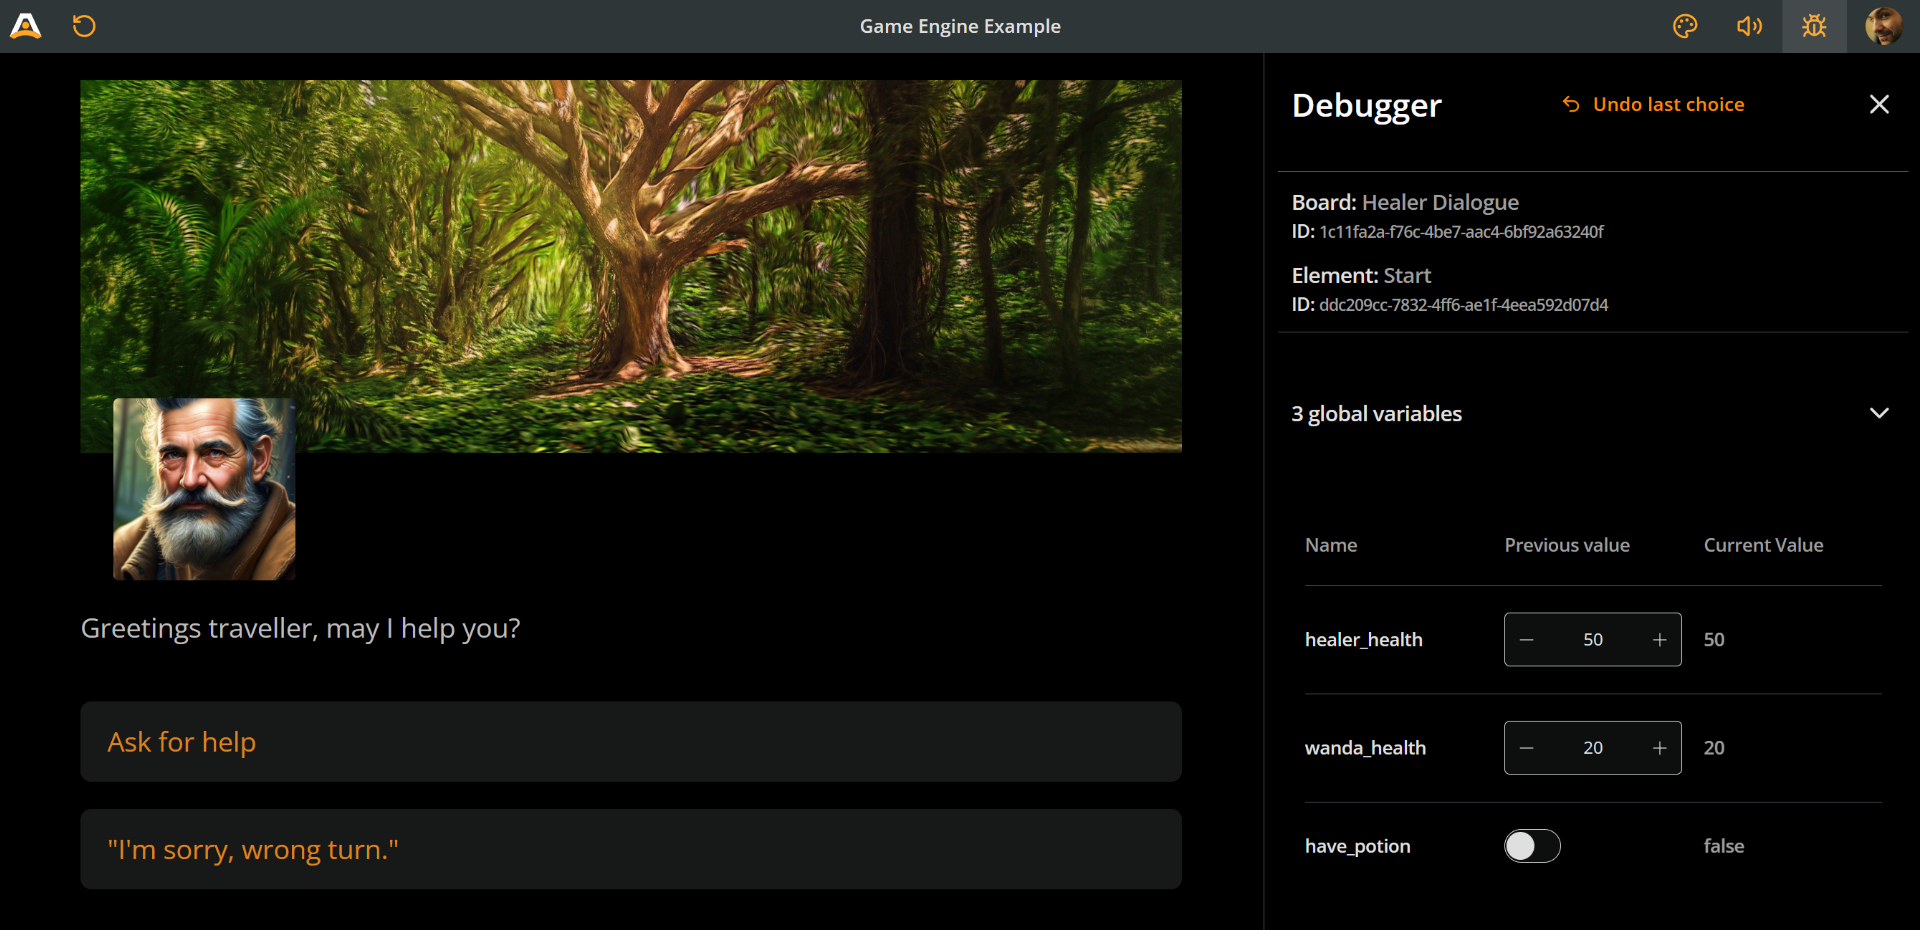
The top part of the Debugger displays information on the current board and element:
- Current board:
- Current element:
ℹ️ Uses of the board and element ID include accessing the items in the project's JSON, as well as targeting the element for CSS styling in the Style Editor; see the CSS basics guide.
Variables tracking
The area beneath the identifiers panel displays a list of the project's variables, providing real-time tracking and debugging during playthrough.
Each row in the list includes:
- Name: The variable's identifier, as defined in the project's variables list.
- Previous value (editable): The variable's value before loading the current element.
- Current value: The variable's value after loading the current element.
ℹ️ When Arcweave loads an element that contains arcscript segments, those segments execute sequentially in their defined order. If any segment assigns a new value to a variable, the update appears in the Current value column.
The Previous value field's type depends on the variable's type, as declared in the variables list.
Edit a variable's Previous value allows you to test the logic of the current element. Updating this field immediately recalculates:
- The variable's Current value
- The values of any other variables updated by code within the current element
- Text content that depends on the variable (e.g., via
ifexpressions) - Available options that depend on the variable (e.g., via branch logic)